
FAQ
Network Standards
We run multiple, overlapping network monitoring tools, in order to provide us with quality of service and service stability information. These monitoring tools:
- measure uptime, stability and radio performance of our wireless long-range antennas,
- alert us when they fail to perform,
- back up all devices — both customer routers, antennas and core routers,
- allow us to manage the wireless spectrum in congested areas efficiently,
- quickly and effectively troubleshoot issues,
- collect all logging information back to our Graylog logging platform for further analysis.
Pipeline CRM
Our customer relationship management (CRM) application — Pipeline — performs monitoring via our secondary tools, and gives us an over-arching ‘dashboard’ of network health.
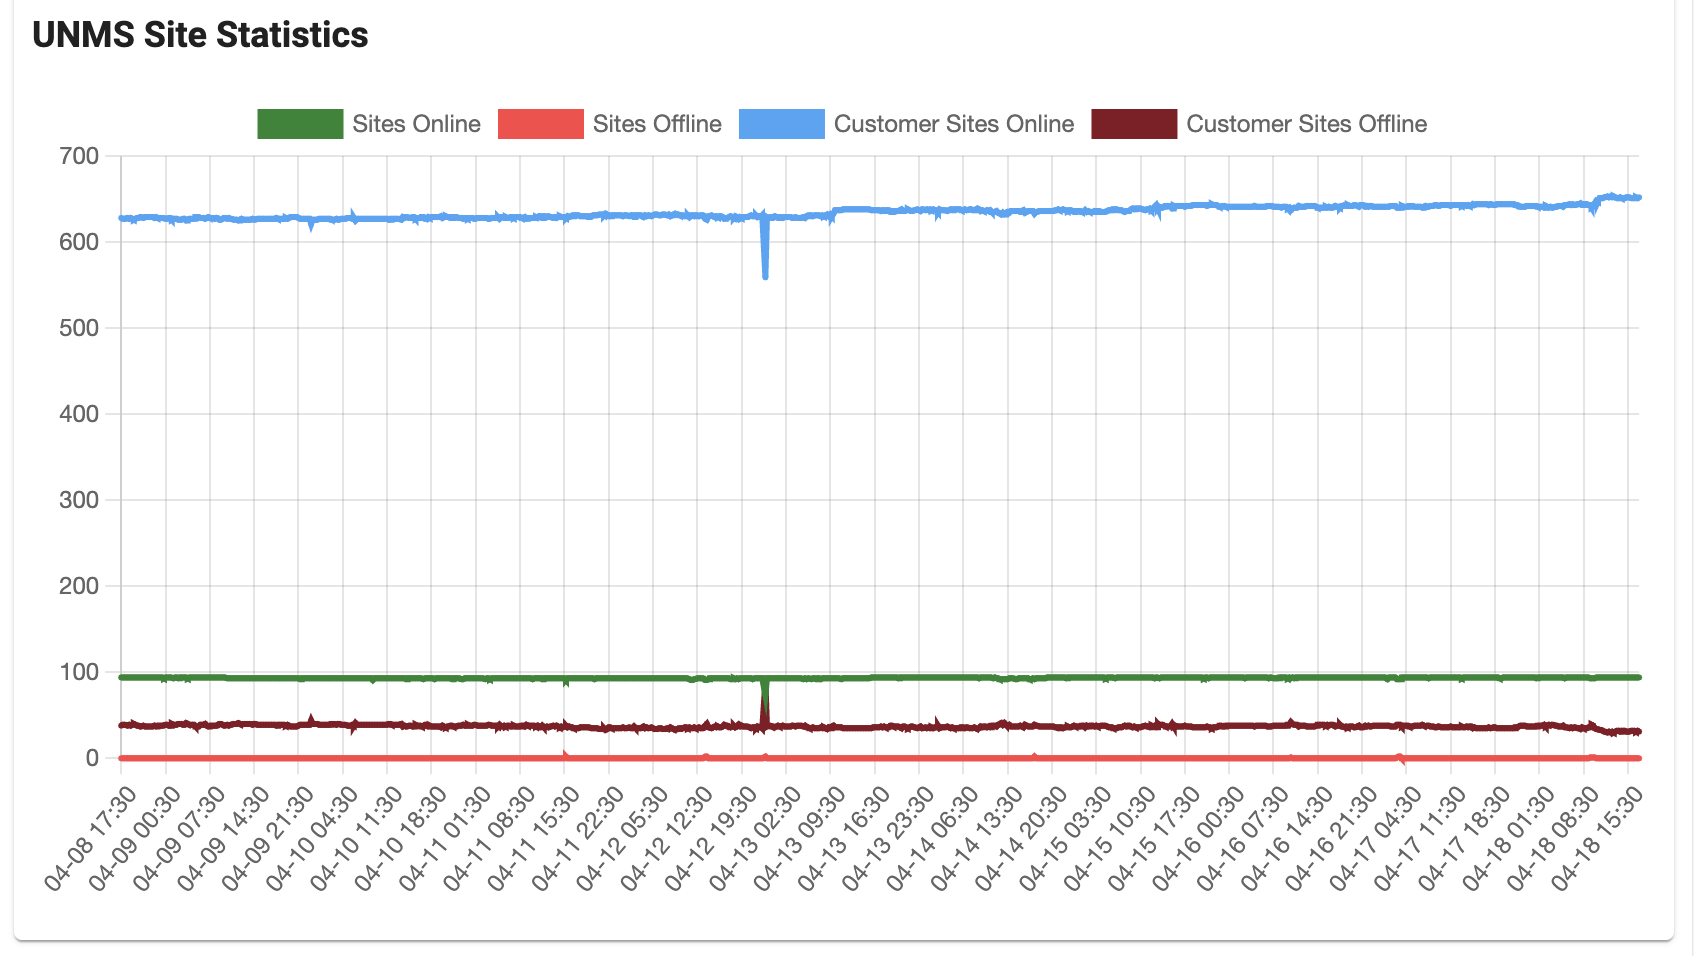
UNMS — Ubiquiti Network Management Services — is our monitoring package which looks after our long-range wireless devices. Each antenna — transmitter or receiver — calls back to UNMS and gives updates each minute.
This graph shows the total number of customer antennas logged in at any single point in time (blue line, top), and ‘Sites’ (main transmission sites) in green.
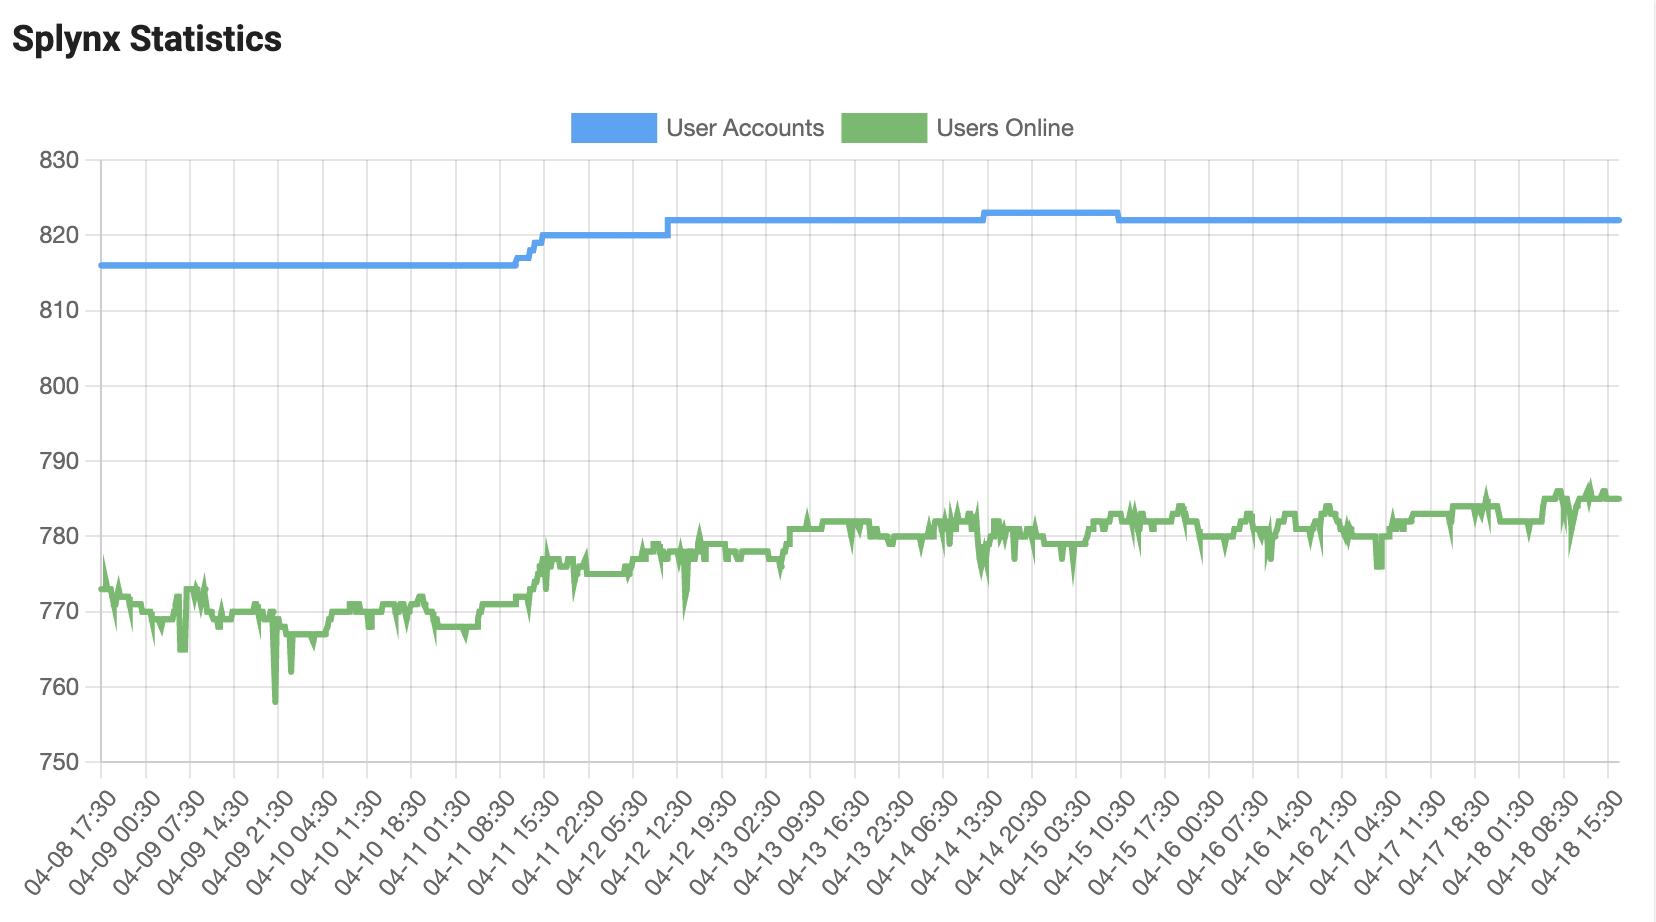
This shows the number of currently connected customer routers (in green) over time.
Splynx is our RADIUS (authentication) server — which tracks, monitors and rate-limits customer routers.
This graph is slightly easier to understand — it gives us a 10-day rolling view on the number of customers who are logged in to our network. Note that this graph is not in proportion — it does NOT go down to zero on the X axis. The ‘jitter’ represents a small number of individual customers switching off their routers overnight.